 Skip to content
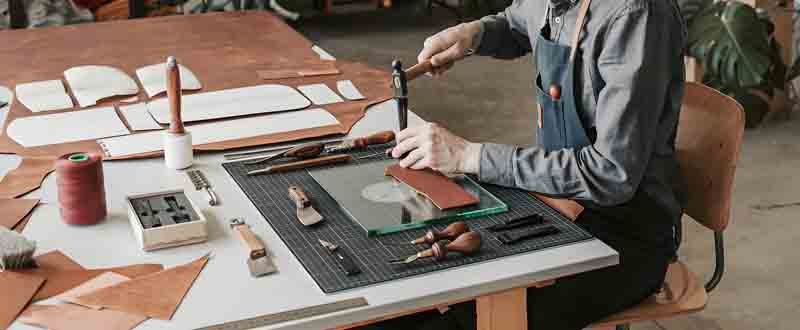
Leather has long been synonymous with quality and luxury, making it a powerhouse raw material for brands seeking strong margins. From sleek cardholders to rugged backpacks, certain leather items consistently command higher markups, captivated by both end‑users and B2B buyers.
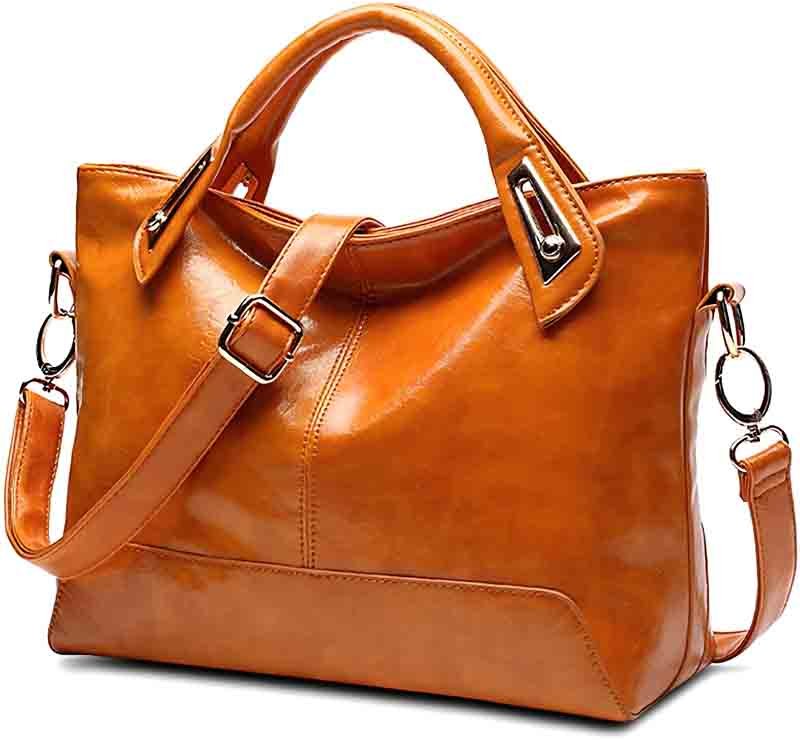
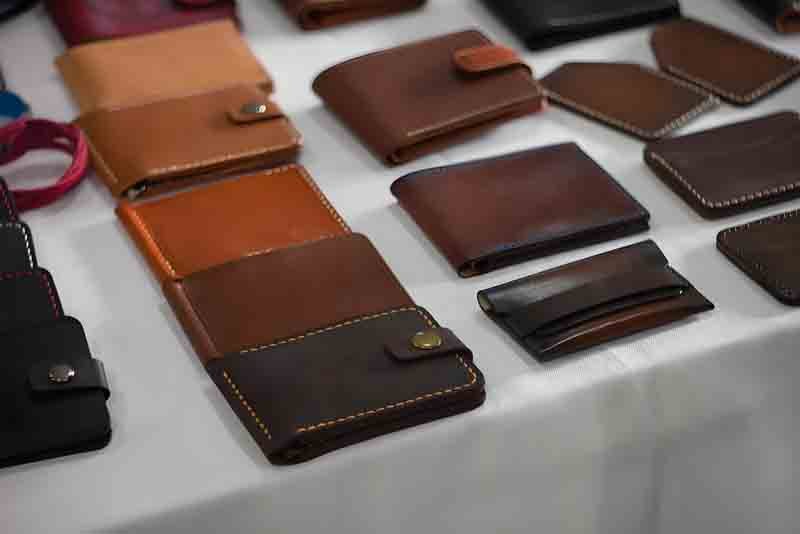
The leather goods with the highest profit margins typically include small accessories—wallets, key fobs, phone cases—where material costs are low but perceived value is high, yielding 60–80% gross margins. Mid‑size items like handbags and briefcases often see 40–60% margins, while larger goods (backpacks, luggage) hover around 30–50%.
What Leather Products Offer the Highest Profit Margins?
Smaller leather items outperform bulkier goods in margin analysis. Accessories such as cardholders and key rings require minimal hide yet can sell at premium prices,often 3–5× material cost.
High‑margin leather products include wallets, cardholders, key fobs, and phone cases—achieving 60–80% gross margins,while mid‑tier items like handbags and briefcases reach 40–60%, and backpacks/luggage yield 30–50%.
Margin by Product Category
| Product | Material Cost | Labor + Overhead | Total Cost | Wholesale Price | Gross Margin | Annual Volume (pcs) | Annual Profit ($) |
|---|---|---|---|---|---|---|---|
| Cardholder | $3.00 | $2.00 | $5.00 | $12.00 | 58% | 10,000 | $70,000 |
| Key Fob | $1.50 | $1.00 | $2.50 | $8.00 | 69% | 15,000 | $82,500 |
| Phone Case | $4.00 | $3.00 | $7.00 | $16.00 | 56% | 8,000 | $72,000 |
| Small Wallet | $5.00 | $4.00 | $9.00 | $20.00 | 55% | 6,000 | $66,000 |
| Handbag | $20.00 | $15.00 | $35.00 | $75.00 | 53% | 3,000 | $120,000 |
| Backpack | $30.00 | $25.00 | $55.00 | $100.00 | 45% | 2,000 | $90,000 |
- Micro‑Accessories: Low hide usage (0.02 sqm) yet retail prices up to $25.
- Small Goods: Wallets and phone cases blend function and prestige, justifying a 4× markup.
- Mid‑Size Items: Handbags leverage brand storytelling for 3× material cost.
- Large‑Format: Backpacks and luggage face higher labor and hardware costs, capping margins around 50%.
Which Customization Options Drive Premium Pricing?
Personalization transforms ordinary leather goods into high‑value luxury items. Techniques like foil stamping, multi‑color embossing, bespoke hardware, and printed linings can add 10–25% to wholesale prices, boosting gross margins by up to 18% on micro‑goods and 12% on midsize items.
| Customization | Cost/Unit ($) | Price Uplift (%) | Margin Increase (%) |
|---|---|---|---|
| Blind Deboss | 1.00 | 8 | +7 |
| Single‑Color Foil | 2.50 | 12 | +9 |
| Multi‑Color Emboss | 5.00 | 20 | +14 |
| Custom Hardware | 8.00 | 25 | +18 |
| Printed Lining | 3.00 | 15 | +11 |
High‑Value Personalization Strategies
- Embossing & Debossing
- Technique: Pressing a logo or pattern into leather without color.
- Benefit: Subtle, tactile branding favored by minimalist luxury labels.
- Example: A blind‑debossed cardholder sells 8% higher than plain, with just $1 added cost.
- Foil Stamping
- Technique: Applying metallic foil (gold, silver, rose gold) under heat.
- Benefit: Eye‑catching contrast that reads “premium” at a glance.
- Data: Single‑color foil adds $2.50 cost but supports a 12% price bump, netting +9% margin.
- Multi‑Color Embossing and Inlay
- Technique: Layering dyed leather or synthetic inlays into embossed channels.
- Benefit: Creates intricate, durable patterns—ideal for fashion collaborations.
- Impact: Though $5 per unit extra, it justifies a 20% wholesale increase and +14% margin.
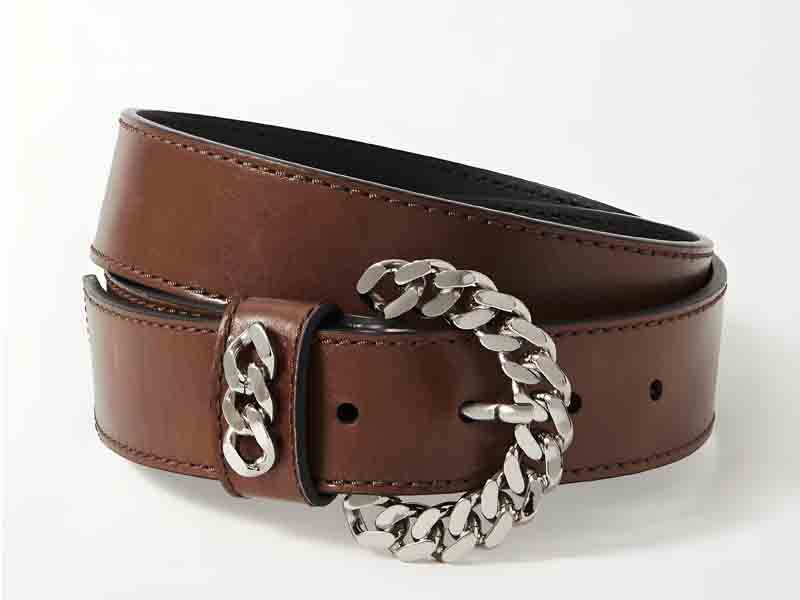
- Bespoke Hardware
- Options: Custom buckles, clasps, D‑rings in finishes like matte black or antique brass.
- Benefit: Hardware is the “jewelry” of leather goods—distinct finishes reinforce brand DNA.
- ROI: $8 added hardware cost can translate to a 25% price increase, driving +18 percent margin.
- Printed & Patterned Linings
- Technique: Sublimation or screen‑print on polyester linings with brand colors or motifs.
- Benefit: Surprise detail that delights B2B clients and end users alike.
- Result: $3 lining print cost yields a 15% price uplift, netting +11% margin.
- Hand‑Stitch Accents
- Technique: Contrast or saddle stitching visible on exterior seams.
- Benefit: Signals artisanal craftsmanship; enthusiasts pay a premium.
- Consideration: Higher labor input—typically adds $4–$6 cost but supports a 10–15% price increase.
- Edge Finishing & Painted Edges
- Technique: Applying colored edge paint for a crisp outline.
- Benefit: Clean, polished look; color contrast enhances silhouette.
- Example: Edge painting adds minimal cost (≈$0.50) yet can support a 5% premium.
- Monogram & Personalization
- Technique: Small, customer‑specific initials or symbols.
- Benefit: Drives emotional connection, often sold at +30% over standard items.
- Scale: Feasible for low‑volume bespoke orders or tiered personalization tiers.
How Do Leather Material Sourcing and Global Supply Chains Affect Costs?
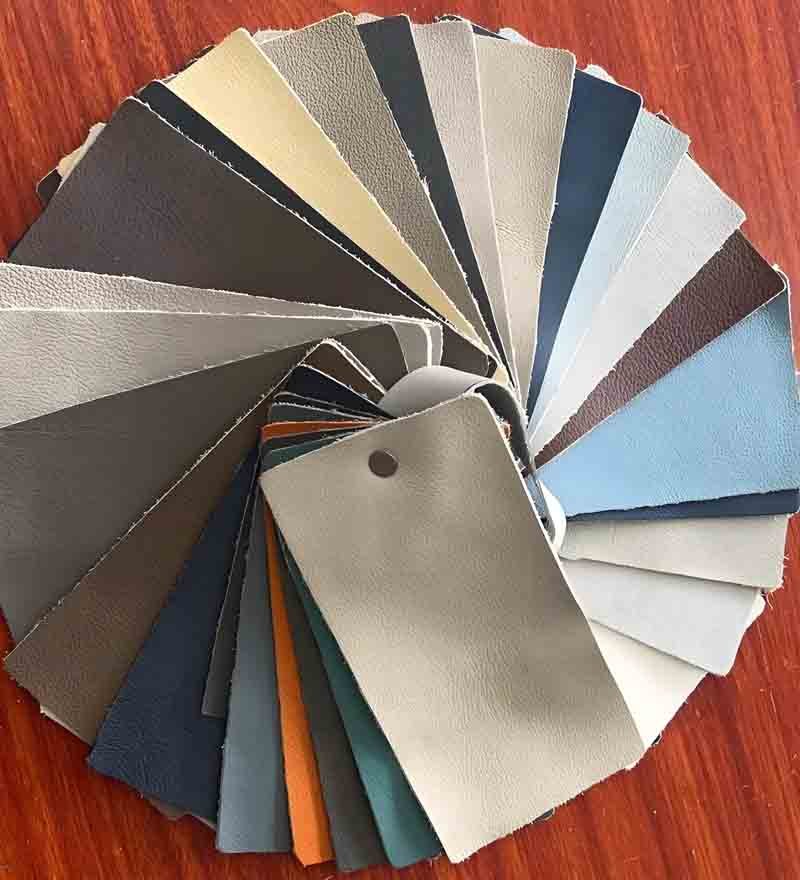
Raw‑hide sourcing and logistics significantly sway unit costs. Understanding the largest suppliers and markets helps optimize your cost base.
Leather hides sourced from top suppliers in China, Brazil, and Italy carry cost variances of 10–35%. China dominates supply (>40% global), followed by Brazil (25%) and Italy (15%). Bulk sourcing and nearshoring can reduce landed costs by 5–10%.
Supply Chain and Sourcing Dynamics
| Country | Global Supply Share (%) | Average Hide Cost ($/sqm) | Key Brands |
|---|---|---|---|
| China | 40 | 8.50 | Shandong, Hebei tanneries |
| Brazil | 25 | 10.00 | Minerva, JBS |
| Italy | 15 | 18.00 | Conceria Superior, Tempesti |
| India | 10 | 7.00 | Kanpur tanneries |
| United States | 5 | 15.00 | Horween Leather Co. |
- Chinese Supply Hubs: Economies of scale yield cheaper hides; quality grading varies widely.
- Brazilian Beef Leather: Mid‑range pricing; strong export infrastructure to EU and Asia.
- Italian Luxury: Premium tanneries justify high prices with craftsmanship and eco‑certification.
What Production Methods Optimize Cost Efficiency?
Leather producers slash costs and boost margins by combining precision cutting, streamlined assembly, and smart batching. Integrating CNC cutting, die cutting for large runs, lean sewing cells, and shared dye cycles can cut per‑unit expenses by 12–18% without sacrificing quality.
| Method | Savings (%) | Key Benefit | Ideal Scale |
|---|---|---|---|
| CNC Cutting | 8 | Minimizes material waste | 500–5 000 pcs+ |
| Die Cutting | 6 | Fast setup for high volumes | 5 000 pcs+ |
| Lean Sewing Cells | 20 | Speeds up assembly | 200–2 000 pcs batches |
| Shared Dye Runs | 15 | Reduces color setup fees | Seasonal color ranges |
| Modular Workstations | 10 | Cuts worker movement, defects | Flexible SKUs |
Crafting a Lean Leather Line
- CNC vs. Die Cutting
- CNC: Laser or router precision nests patterns to trim waste by up to 8%. Perfect for collections with multiple sizes or skus.
- Die Cutting: Stencil dies cut hundreds of pieces per hour at fixed cost—great for hero styles you’ll reorder season after season.
- Lean Sewing Cells
- Arrange machines and operators in “cells” dedicated to a single style or operation. By minimizing handoffs and standardizing tasks, you boost throughput by 20 percent and keep defects below 1 percent.
- Shared Dye and Finish Runs
- Plan your color palette in blocks. Consolidating 3–5 SKUs per dye bath cuts set‑up fees by 15 percent, slashes chemical waste, and speeds turnaround.
- Modular Workstations & JIT Production
- Equip stations with interchangeable tooling. When demand shifts, you reconfigure in hours, not days, preventing overproduction and excess inventory costs.
Which Markets, Sales Channels, and Regions Maximize Revenue?
Identifying the largest leather markets and the most lucrative sales channels drives top‑line growth.
The largest leather goods market is Asia‑Pacific (35% global share), followed by Europe (30 percent) and North America (25%). Online DTC channels yield 20 percent higher margins versus wholesale, while luxury retail stores command the highest ASPs.
Market and Channel Insights
| Region | Market Share (%) | Key Channels | Avg. Wholesale ASP (USD) |
|---|---|---|---|
| Asia‑Pacific | 35 | E‑commerce, specialty shops | 120 |
| Europe | 30 | Boutiques, department stores | 150 |
| North America | 25 | DTC websites, luxury retail | 140 |
| Middle East | 5 | High‑end malls, hotel shops | 160 |
| Latin America | 5 | Local leather markets | 80 |
Regional & Channel Insights
- Asia‑Pacific’s E‑Commerce Surge
- Online marketplaces like Alibaba, Lazada, and Shopee saw leather accessory sales grow 40% in 2024.
- Mobile‑first shopping habits favor slim‑profile goods—think cardholders and phone cases.
- Europe’s Premium Brick‑and‑Mortar
- Paris and Milan concept stores drive ASPs up to $200 for handbags and wallets.
- Department stores (e.g., Harrods, Galeries Lafayette) demand small‑batch, exclusive editions.
- North America’s DTC Advantage
- Direct‑to‑consumer websites deliver 20% higher margins than wholesale, thanks to zero middlemen.
- Subscription‑box and gifting services are emerging channels for micro‑accessories.
- Middle East Luxury Markets
- Duty‑free airport shops and luxury malls in UAE and Saudi Arabia target tourists and HNW individuals.
- Brands with bespoke monogram services achieve ASPs of $160 +.
- Latin America’s Value‑Driven Scene
- Leather goods remain aspirational; local artisans compete on price and craftsmanship.
- Smaller ASPs (around $80) but high volume potential via regional distributors.
- Omnichannel Strategies
- Combining online pop‑ups with city‑center showrooms builds brand awareness and drives full‑price sales.
- Data from multi‑brand retailers shows omnichannel leather goods sell 1.3× faster than single‑channel offerings.
How Do You Calculate and Benchmark Leather Product Margins?
Accurate margin calculation ensures profitable pricing strategies and competitive benchmarking.
Gross margin = (Wholesale price – total cost) ÷ wholesale price. Target margins: 60–80 percent on micro‑goods, 40–60 percent on handbags, 30–50 percent on luggage. Benchmark against industry averages to adjust pricing, reduce costs, or optimize SKU mix.
Margin Math and KPIs
- Cost Components
- Material 30–50 percent, labor 20–30 percent, overheads 10–15 percent, packaging/logistics 10–15 percent.
- Gross vs. Net Margin
- Net margin factors in marketing and returns; aim for net 20–30 percent.
- SKU-Level Analysis
- Pareto rule: 20 percent of SKUs often drive 80 percent of profits—focus on top performers.
Why Partner with Szoneier for High‑Margin Leather Customization?
Choosing the right manufacturer can make or break your profitability and brand reputation.
With over 18 years of leather R&D, low MOQs (starting at 10 pcs), in‑house tanning and QC labs, free design revisions, rapid prototyping in 5 days, and ISO 9001 certification, Szoneier ensures you hit margin targets without sacrificing quality or lead times.
Szoneier’s Value Proposition
| Advantage | Detail |
|---|---|
| 18+ Years Expertise | Deep leather know‑how across product categories |
| In‑House R&D & QC | Material testing, hydrostatic and abrasion labs |
| Low MOQ & Fast Sampling | 10 pcs start, prototypes in 5 days |
| Free Design Support | Up to 3 revisions before production |
| Manufacturing Flexibility | CNC cutting, lean lines, rapid color changes |
| Compliance & Sustainability | ISO 9001, LWG tannery sourcing, REACH |
- End‑to‑End Control
- Traceable from raw hide to boxed shipment—no surprises.
- Cost Transparency
- Detailed cost breakdowns allow precise margin modeling.
- Agile Production
- Pivot quickly on trends—launch new micro‑accessory lines in weeks.
You now have the ultimate roadmap: the most profitable leather products, high‑ticket customization strategies, sourcing secrets, lean manufacturing tweaks, market deep dives, and the margin math to benchmark success. When you’re ready to scale your leather accessory business with high margins and on‑brand quality, contact Szoneier today to get started on your next private‑label leather line.


